What exactly is cluster analysis?
Cluster analysis or clustering is the task of grouping a set of objects in a way that objects in the same group are more similar to each other than to objects in other groups (clusters). It is a main task of exploratory data mining and a common technique for statistical data analysis, used in many fields, including machine learning, pattern recognition, image analysis, information retrieval, bioinformatics, data compression etc.
Clustering based on similarity matrix
In this short tutorial we’ll do a cluster analysis using similarity matrix. It is a fast way to group objects based on chosen similarity measure.
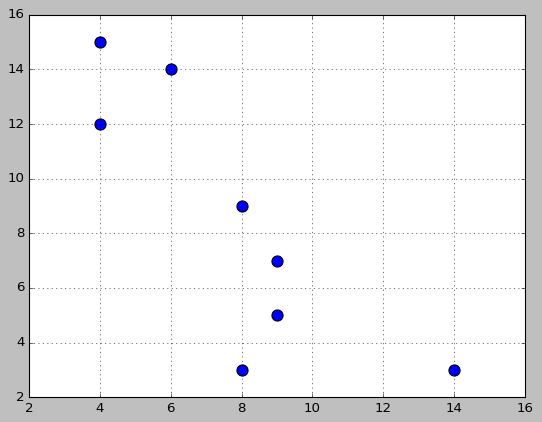
We will try to group next set of points:
(4,15), (6,14), (4,12), (8,9), (9,7), (9,5), (8,3), (14,3)
1. Generating similarity matrix
After the data is collected we can move on to creating similarity matrix. We will do this by calculating similarity distance between all objects in the set. From the above example set we get next values:
D00=0.00 D01=2.24 D02=3.00 D03=7.20 D04=9.43 D05=11.18 D06=13 D07=15.62

D11=0.00 D12=2.83 D13=5.39 D14=7.62 D15=9.49 D16=11.18 D17=13.60

D22=0.00 D23=5.00 D24=7.07 D25=8.60 D26=9.85 D27=13.45

D33=0.00 D34=2.24 D35=4.12 D36=6.00 D37=8.40

D44=0.00 D45=2.00 D46=4.12 D47=6.40

D55=0.00 D56=2.24 D57=5.39

D66=0.00 D67=6.00

D77=0.00
Also we need to define the threshold value which will be used to separate objects into different groups if the similarity distance is greater than the provided threshold value. In this example let’s define our threshold as θ = 4.00
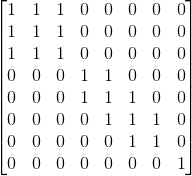
Now, generating similarity matrix should be easy. Rows and columns are representing the exact object, so for example if row is at index 2 and column is at index 4, it means we are considering similarity distance between object 2 and object 4. But we are not putting that distance into the matrix, because we need only the chain of similarity between the objects. So, comparing the distance between objects with the threshold value should decide if we are putting 1 or 0 at the chosen place in the matrix. D24=7.07 and θ=4.00, so D34 > θ which means that we are putting number 1 into that place.
After populating whole matrix, we get this (assuming that indices start with zero):
2. Choose row with the largest sum
Now when we have similarity matrix, we should find the row with the largest sum. In this example there are 5 rows with the largest sum so we pick the first one.
3. Add objects into a new group
We have selected first row in the matrix (i=0) and now all the columns which contain number 1 in the selected row should be added to a new group which will be named G1.
G1 = {0, 1, 2}
Next step in adding objects to a current group is to take those indices from G1, and repeat the previous procedure. If we look at the row with the index value of 1, there are again {0, 1 ,2} indices so we don’t have to add nothing to a group. Then we take index value of 2 and look at that row but there’s also nothing new to add.
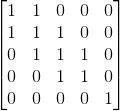
4. Reset rows and columns of grouped objects
Next step after we got a new group is to delete or reset values in the matrix, but only in the rows and columns with indices of newly grouped objects. So if we grouped objects with indices {0, 1, 2} then the matrix should look like this:
Now we are going back to the step no. 2, where we choose a new row to be processed and we repeat the same procedure until our whole matrix only contains zeroes as values.
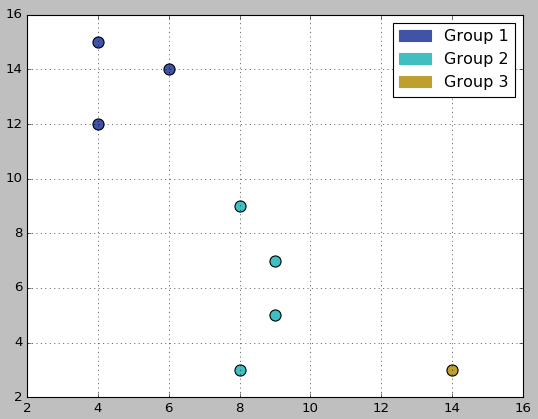
Results of clustering procedure
After the clustering procedure is finished, objects from the above example are divided into 3 different clusters, like shown on the picture below.
Clustering algorithm in Python
Here is a short tutorial on how to create a clustering algorithm in Python 2.7.11 using NumPy and visualize it using matplotlib.
We first need to input our data:
import numpy as np
import matplotlib.pyplot as plt
import matplotlib.patches as mpatches
from math import sqrt

def process_input(line):
	x, y = line.split(",")
	samples.append((float(x.strip()), float(y.strip())))

samples = []
while True:
	line = raw_input()
	if line == "END":
		break
	process_input(line)

for x in samples:
	plt.scatter(x[0],x[1], s=100)
plt.grid()
plt.show()

threshold = int(raw_input("Threshold: "))
In the above code snippet first it’s initialized a list which will contain features of different objects. Then input is provided (example: 3.1, 4.5) and processed, and it stops by inputing “END”. To visualize provided input we use matplotlib scatter function and we can see the data in the coordinate system. At the end there’s also threshold that should be provided.
We populate the similarity matrix:
def euclideanDistance(x1, x2):
	suma = 0
	for i in range(len(x1)):
		suma += pow(x1[i] - x2[i], 2)
	return sqrt(suma)

def buildSimilarityMatrix():
	numOfSamples = len(samples)
	matrix = np.zeros(shape=(numOfSamples, numOfSamples))
	for i in range(len(matrix)):
		for j in range(len(matrix)):
			dist = euclideanDistance(samples[i], samples[j])
			if dist > threshold:
				matrix[i,j] = 1
	return matrix

mat = buildSimilarityMatrix()
Everything is now ready to start a clustering process. To do that we create a main function to handle clustering process and it delegates different steps to few more other functions.
def categorizeIntoClusters(matrix):
	groups = []
	while np.sum(matrix) > 0:
		group = []
		row = determineRow(matrix)
		indexes = addIntoGroup(matrix, row)
		groups.append(indexes)
		matrix = deleteChosenRowsAndCols(matrix, indexes)
	return groups

groups = categorizeIntoClusters(mat)
Cluster analysis is done iteratively, list ‘groups’ is defined which will contain different clusters. First we have to determine the row in the matrix with the highest number of ones, then we add all the connected objects into the group and at the end of iteration we have to reset all ones to zeroes in the columns and rows belonging to grouped objects. After all objects are processed there should be no more ones in the matrix, so that’s the stopping condition.
Here are the functions doing all the above job:
def sumRow(matrix, i):
	return np.sum(matrix[i,:])

def determineRow(matrix):
	maxNumOfOnes = -1
	row = -1
	for i in range(len(matrix)):
		if maxNumOfOnes < sumRow(matrix, i):
			maxNumOfOnes = sumRow(matrix, i)
			row = i
	return row

def addIntoGroup(matrix, ind):
	change = True
	indexes = []
	for col in range(len(matrix)):
		if matrix[ind, col] == 1:
			indexes.append(col)
	while change == True:
		change = False
		numIndexes = len(indexes)
		for i in indexes:
			for col in range(len(matrix)):
				if matrix[i, col] == 1:
					if col not in indexes:
						indexes.append(col)
		numIndexes2 = len(indexes)
		if numIndexes != numIndexes2:
			change = True
	return indexes

def deleteChosenRowsAndCols(matrix, indexes):
	for i in indexes:
		matrix[i,:] = 0
		matrix[:,i] = 0
	return matrix
Functions sumRow and determineRow are pretty straightforward so we’ll focus at functions addIntoGroup and deleteChosenRowsAndCols. In the addIntoGroup is initalized first set of objects that belong to a current group. Then, new elements will be added if they exist and are connected by similarity matrix (explained in the 3. Add objects into a new group). If there’s nothing more that can be added searching will stop. In the deleteChosenRowsAndCols all the rows and columns of recently grouped objects will be set to zero (explained in the 4. Reset rows and columns of grouped objects).
And that’s it! We have our clusters. We can now visualize them with matplotlib.
for i in range(len(groups)):
	col = np.random.rand(3,1)
	for el in groups[i]:
		plt.scatter(samples[el][0], samples[el][1], c=col, s=100)
	print "Group {}: {}".format(i+1, sorted(groups[i]))

plt.grid()
plt.show()
If you want to see it on my github repo click here.

Thank you so much.
LikeLike